Visualization are individual charts and tables. You can view the visualizations individually or you can put more of them into one dashboard. Visualizations enable you to browse charts and tables people have already created in your account and also create a new visualization.
Navigation
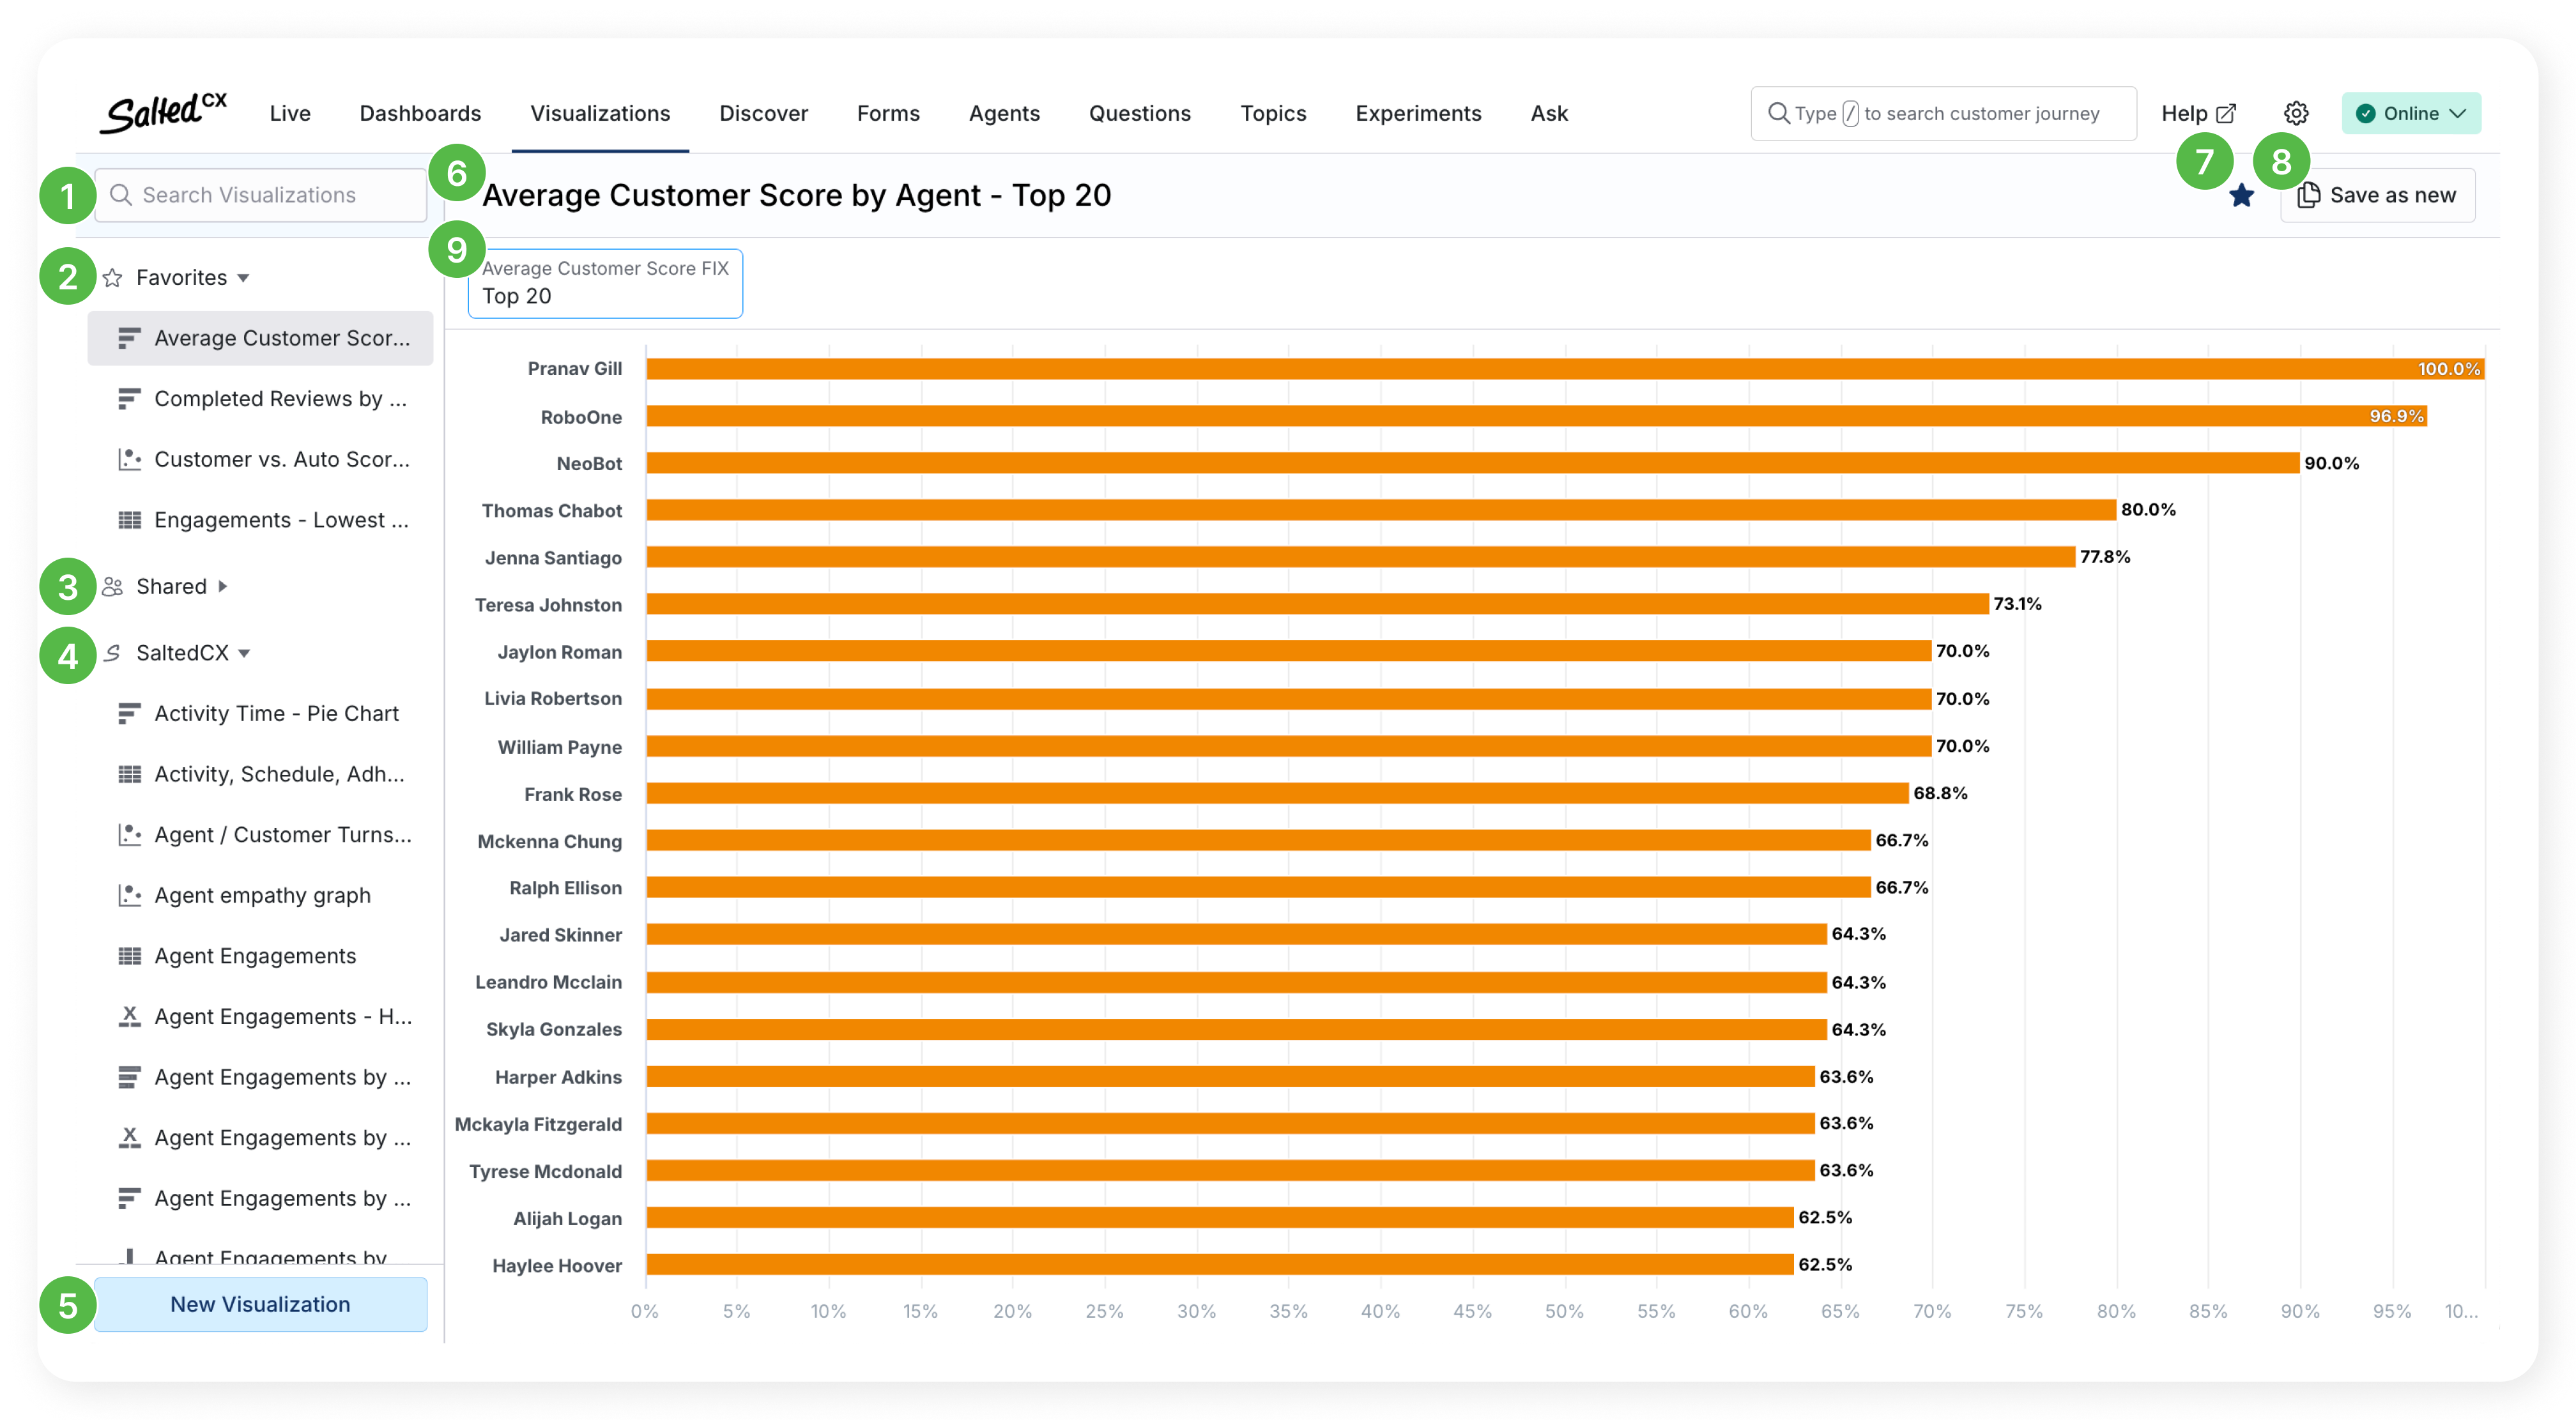
On the left hand you have listed all the visualizations available in your account. You can use search  to search for visualizations by their name.
The visualizations are organized into these sections:
- Favorites
 contain visualizations that you have marked as favorite using the star icon
  in the toolbar. Favorites are individual for you and each use can have their own favorites.
- Shared
 contain visualizations that were created by all users in your account.
- Salted CX
 contain visualizations that are available out of the box with the Salted CX account.
You can create your own visualization by pressing the New Visualization button  .
.
As all items in Salted CX each visualization has its unique web address. You can easily copy the address from the browser URL and send it to your colleagues so they can have a look on the visualization.
Built-in Visualizations
You cannot edit nor delete built-in visualizations. You can use these visualizations to build custom dashboards or use filters  to focus on specific data. You can use all the view-only features depending on the visualization shows including Ask and drill downs to the customer journey.
Press Save as new  to create your own visualization based on the built-in one. This enables you to use the built-in visualization as a starting point and modify it to better suit your business needs.
Custom Visualizations
Visualizations created by users in your account are automatically available to other users. Users with edit permission can also edit these visualizations.
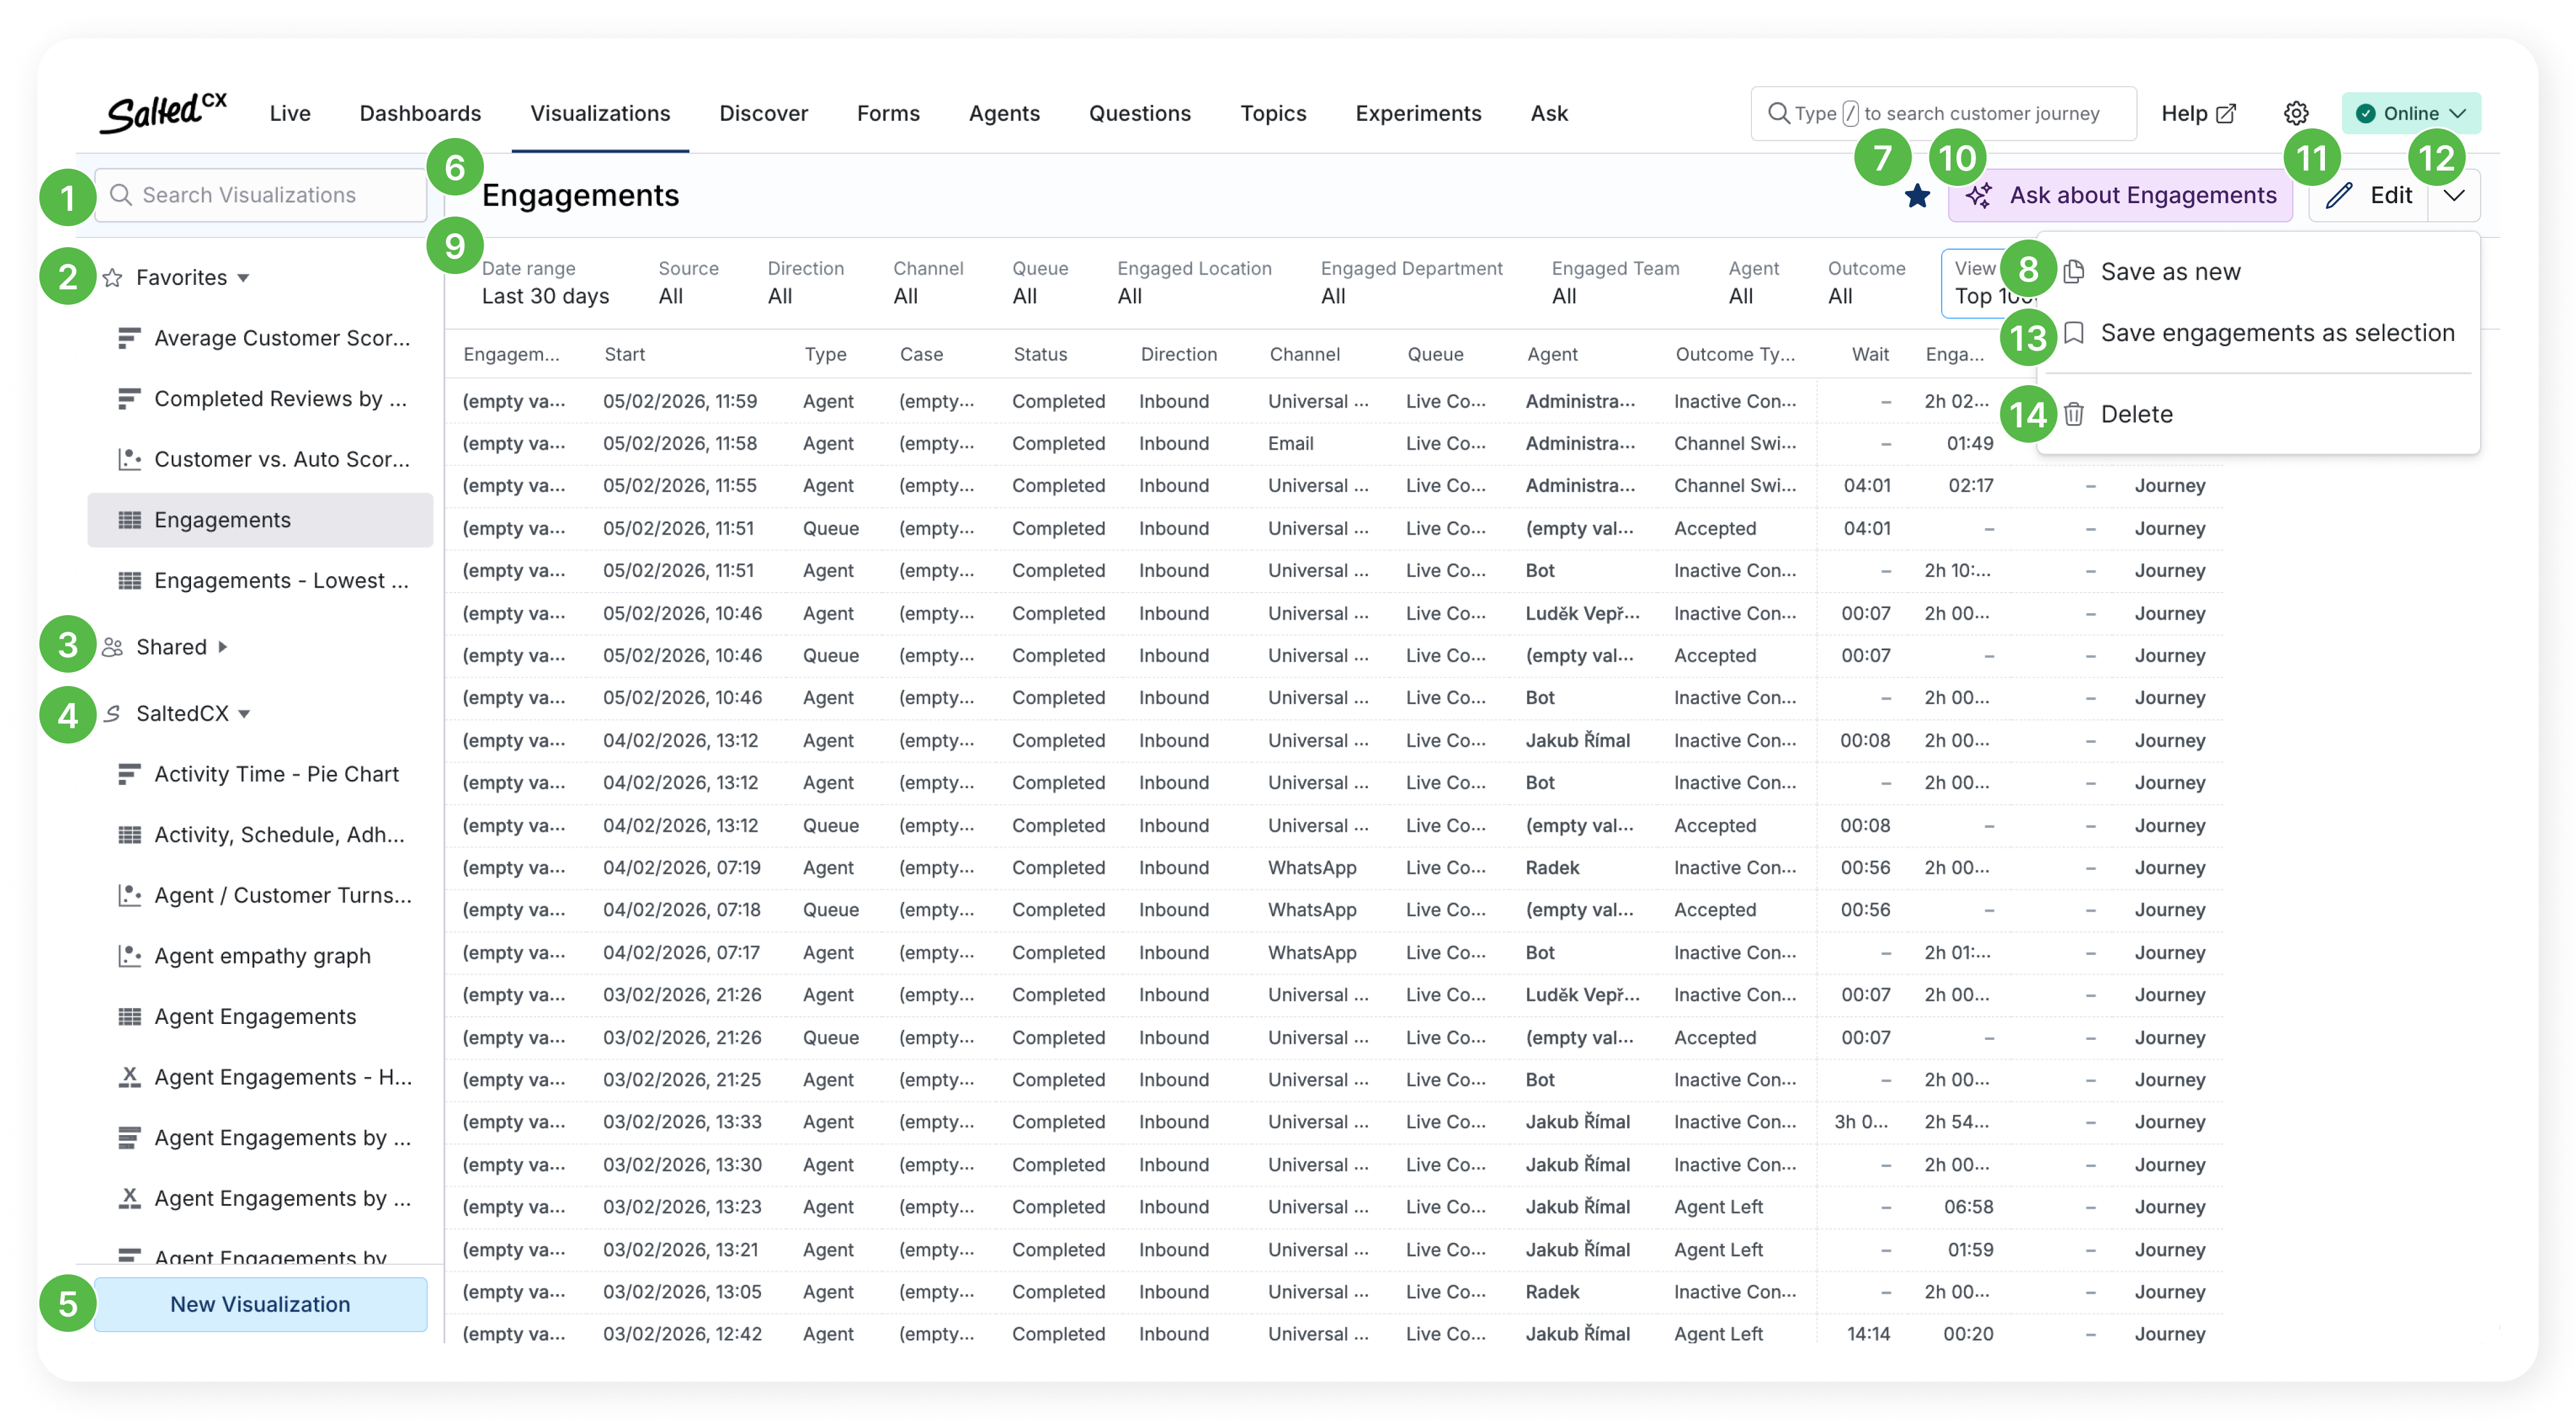
Press Edit  button to open the visualization for editing. For custom visualizations you can still create a copy with Save as new option in the menu if you want to keep the current visualization intact.
You can delete the visualization by pressing the Delete  menu item.
Drill Downs
If any visualization contains individual customers, contacts, conversations, engagements, reviews or transactions you can click on the given item to open customer journey related to it. This enables you to quickly explore root causes behind different issues.
If any visualization contains list of individual agents you can click them to open their agent profile.
Ask
If any visualization contains list of individual engagements or reviews you can click Ask about engagements  or Ask about reviews button to ask questions about the content of the conversations or contents about the customer reviews.
Save Selection
If any visualization contains list of individual engagements or reviews you can click Save engagements as selection  or Save reviews as selection. Saved selection enables you to store the list of engagements that are currently listed in the visualization (matching filtering criteria at the time when you save them) for later use.

You can use selections to have a sample of conversations for training, testing automatic QA, etc.