Segmentation
Segmentation enables you to aggregate metrics by an attribute of choice. In Salted CX you can use any attribute in the Logical Model for segmentation of metrics.
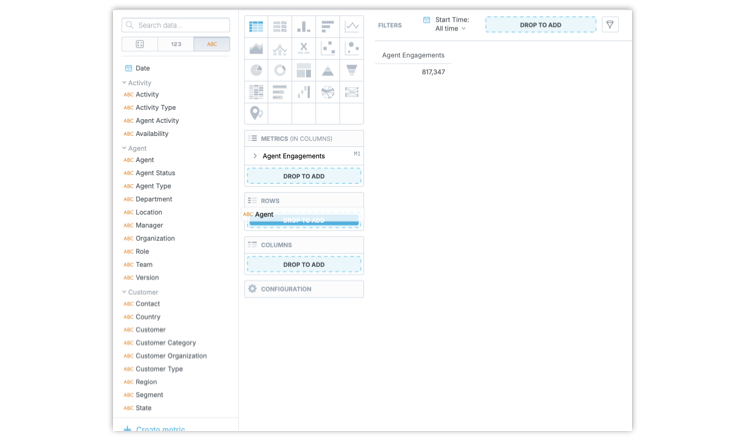
Visualizations
The easiest way to segment a metric is to use any Attribute in a visualization. Metrics are very generic and can be easily segmented by any attribute that makes sense based on Logical Model structure. Visualization editor hides attributes that you cannot use because the metric cannot be segmented by them.
You can use multiple attributes to segment the visualization. Thes
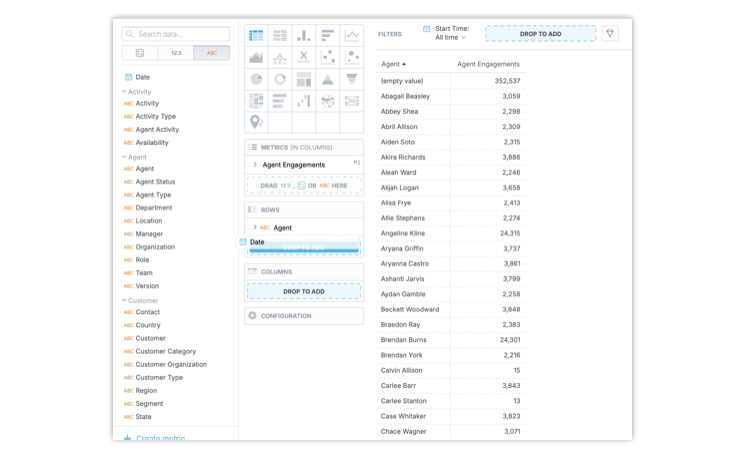
Dates and Time
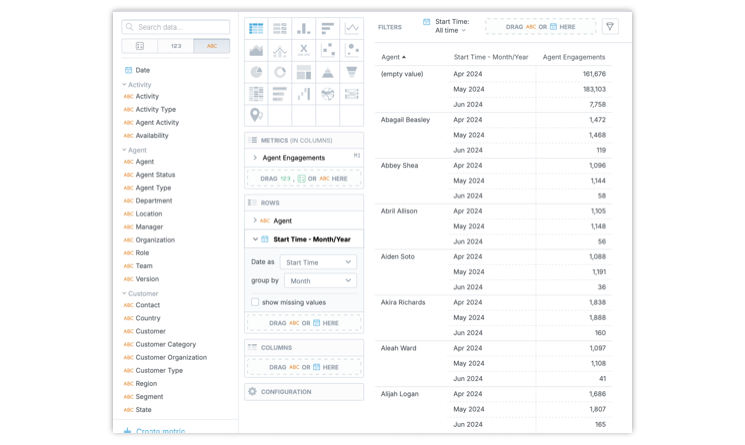
There are multiple dates and times options that enable you to segment by when an enagegement started, engagement ended, review was created, etc. Additionally date and times have a structure. So you can choose the granularity that you use for segmentation by any date and time.
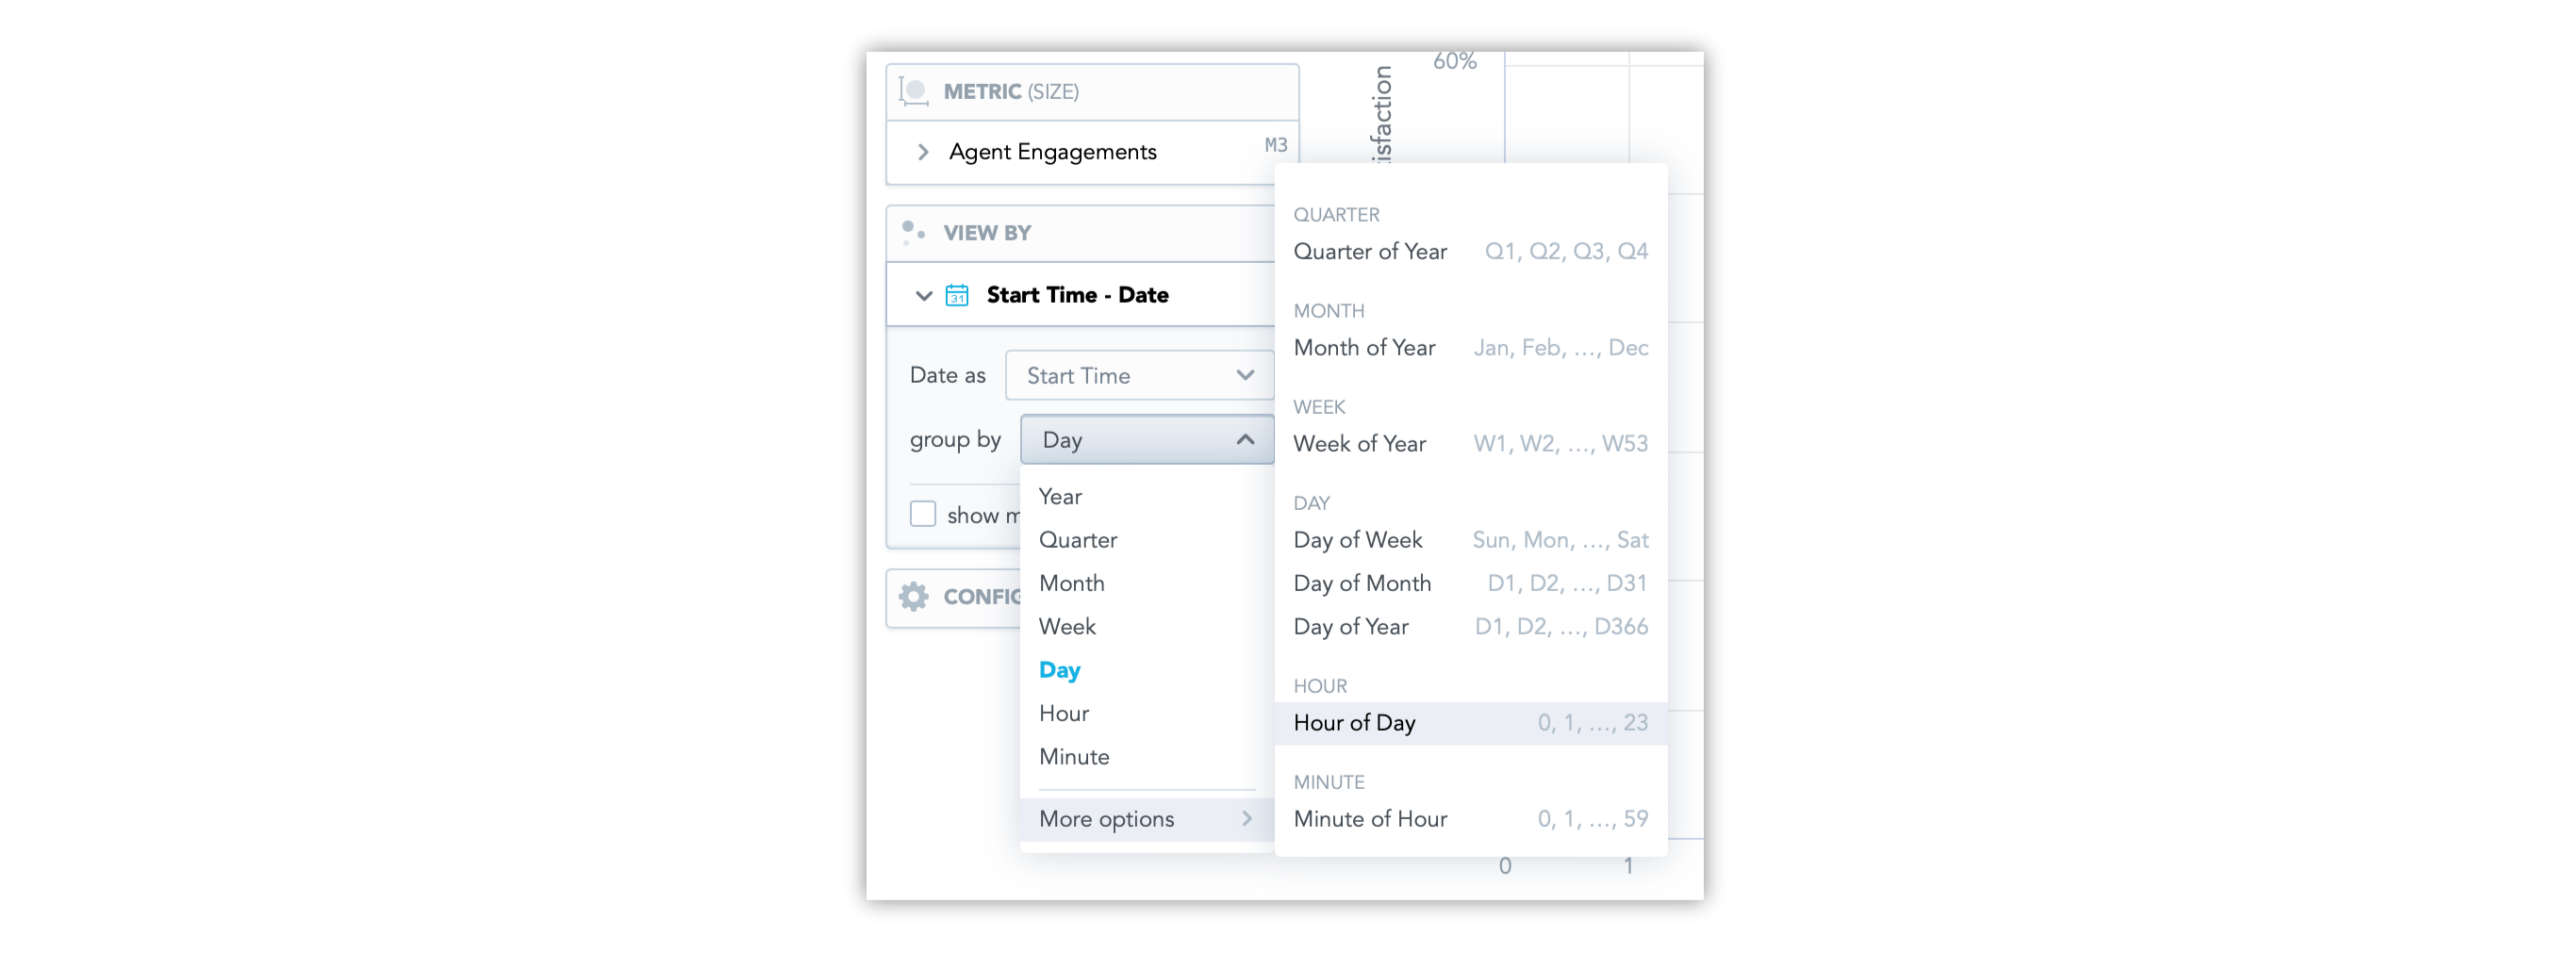
To choose the granularity in visualizations:
- Press group by under the date and time
- Choose the granularity in the menu
- Press More options for additional ways to segment the metrics