Dashboards
Dashboards allow users to combine multiple visualizations on a single canvas and view them from various perspectives.
Built-in Dashboards Filters
Dashboards contain filters to focus report only on specific subset of engagements. Filters influence every visualization in the dashboard and override the filters on visualizations level.
Use filters to focus on specific set of teams, agents, conversations and reviews. Filters help you work on the specific subset of your contact center traffic that is the most relevant for you.
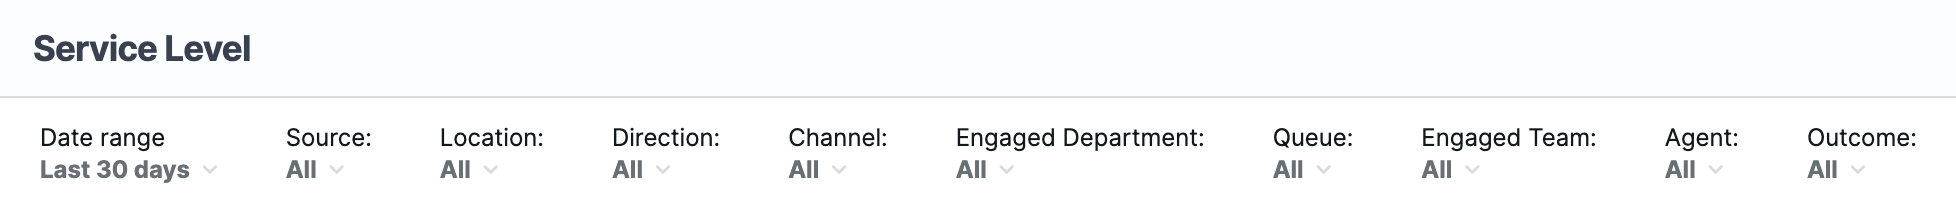
On most dashboards these are the filters:
- Date. The date filter for when the engagements started.
- Source. The connected system or platform that the engagements are extracted from.
- Location. The location associated with the engagements.
- Direction. The direction of the conversations enables to choose whether you focus on Inbound, Outbound or Internal conversation.
- Channel. The communication channel of the engagements.
- Engaged Department. Department in which the agent was when engaged in the conversation.
- Queue. In which the customer was waiting before engaging with the agent.
- Engaged Team. Team in which the agent was when they engaged in the conversation.
- Agent. Agent engaged in the conversation.
- Outcome. Outcome of the engagement, often called disposition or wrap up code.
Some dashboards can contain different set of filters if they make sense for the use case the dashboards are intended for.
You cannot customize filters on the built-in dashboards. To use different filters create your own copy of the dashboard. Learn more about Custom Dashboards
Hidden Filters
Some dashboards may have hidden filters that influence the visualizations in that dashboards. Hidden filters can be used to focus the dashboard on the subset of data it is intended to be used for and avoid misinterpretation of the data. Hidden filters are a convenience feature, not a security feature.
Locked Filters
Locked filters are similar to hidden filters in that they are applied to the dashboard and cannot be changed. However these filters are
Reset Filters
You can click the reset filters button to set the filters to their default values for the current dashboard. This enables you to quickly start any of your explorations from the start again.
Dashboard Views
You can save the current filters in dashboards for later use using saved views. This is useful to have dashboards filtered to what is the most important for each user. For example this can be their team, their department, agents that need more help, etc.
Each user has their own views. Views created by one user is not visible by other users.
Save Filters
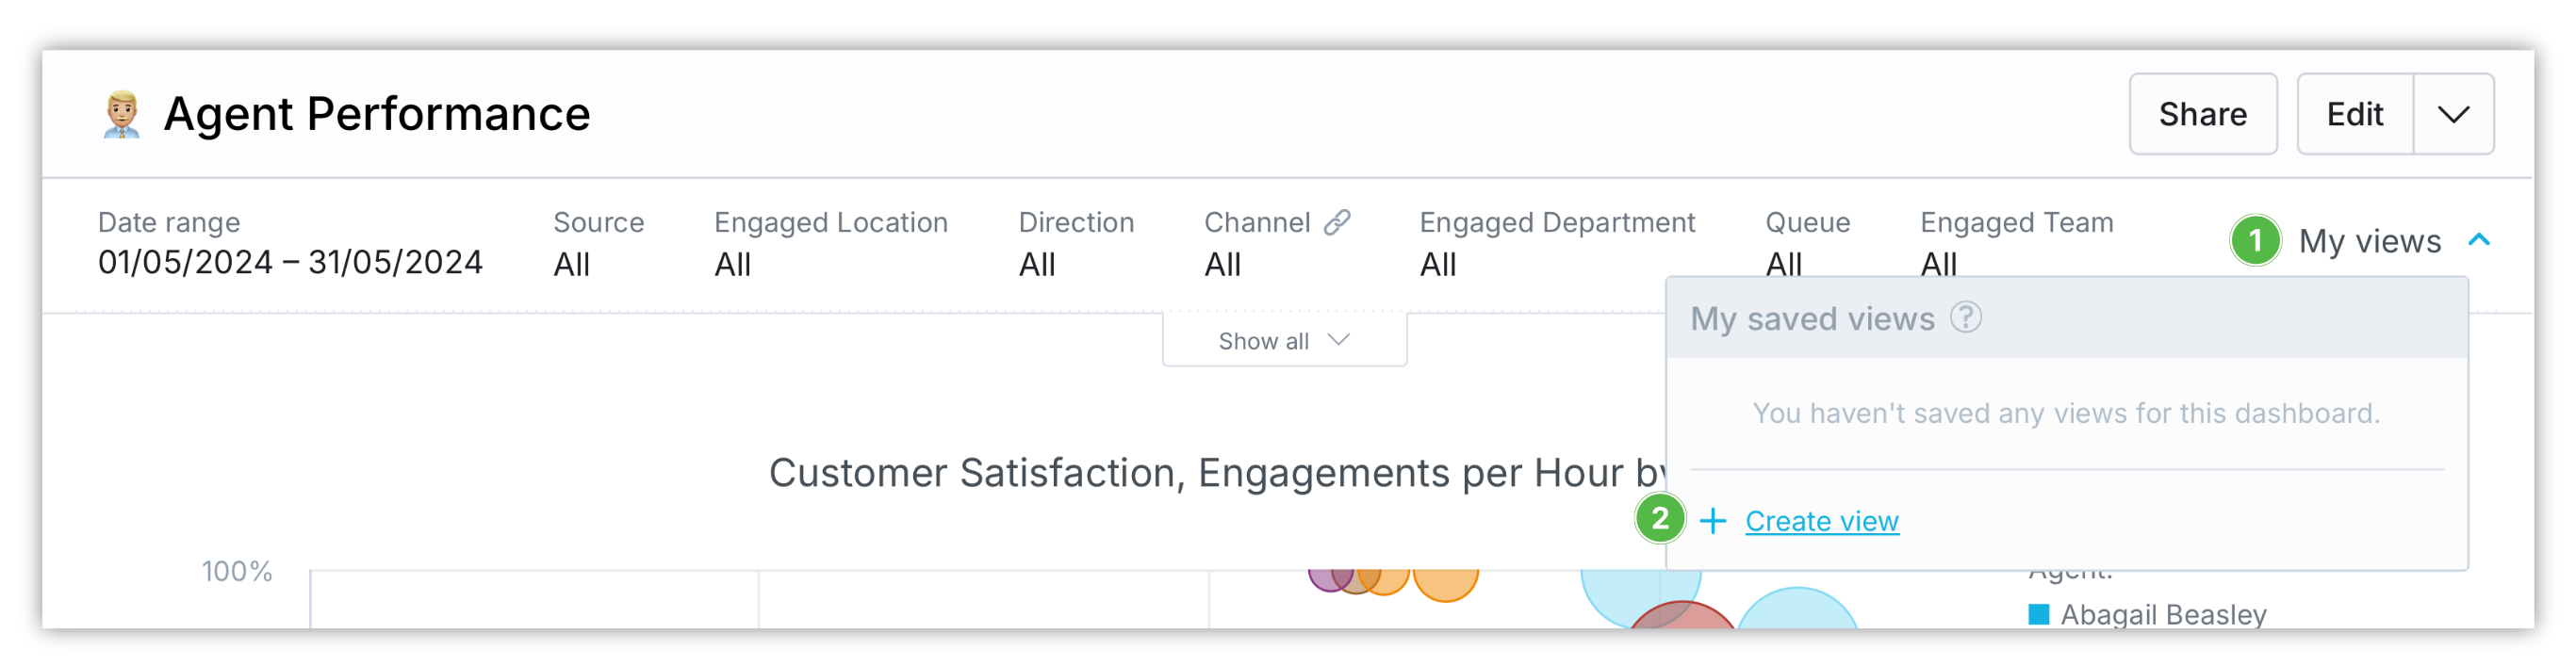
When you want to save your current filters:
-
Click My views in the top right corner of the dashboard
-
Click Create view in the menu
-
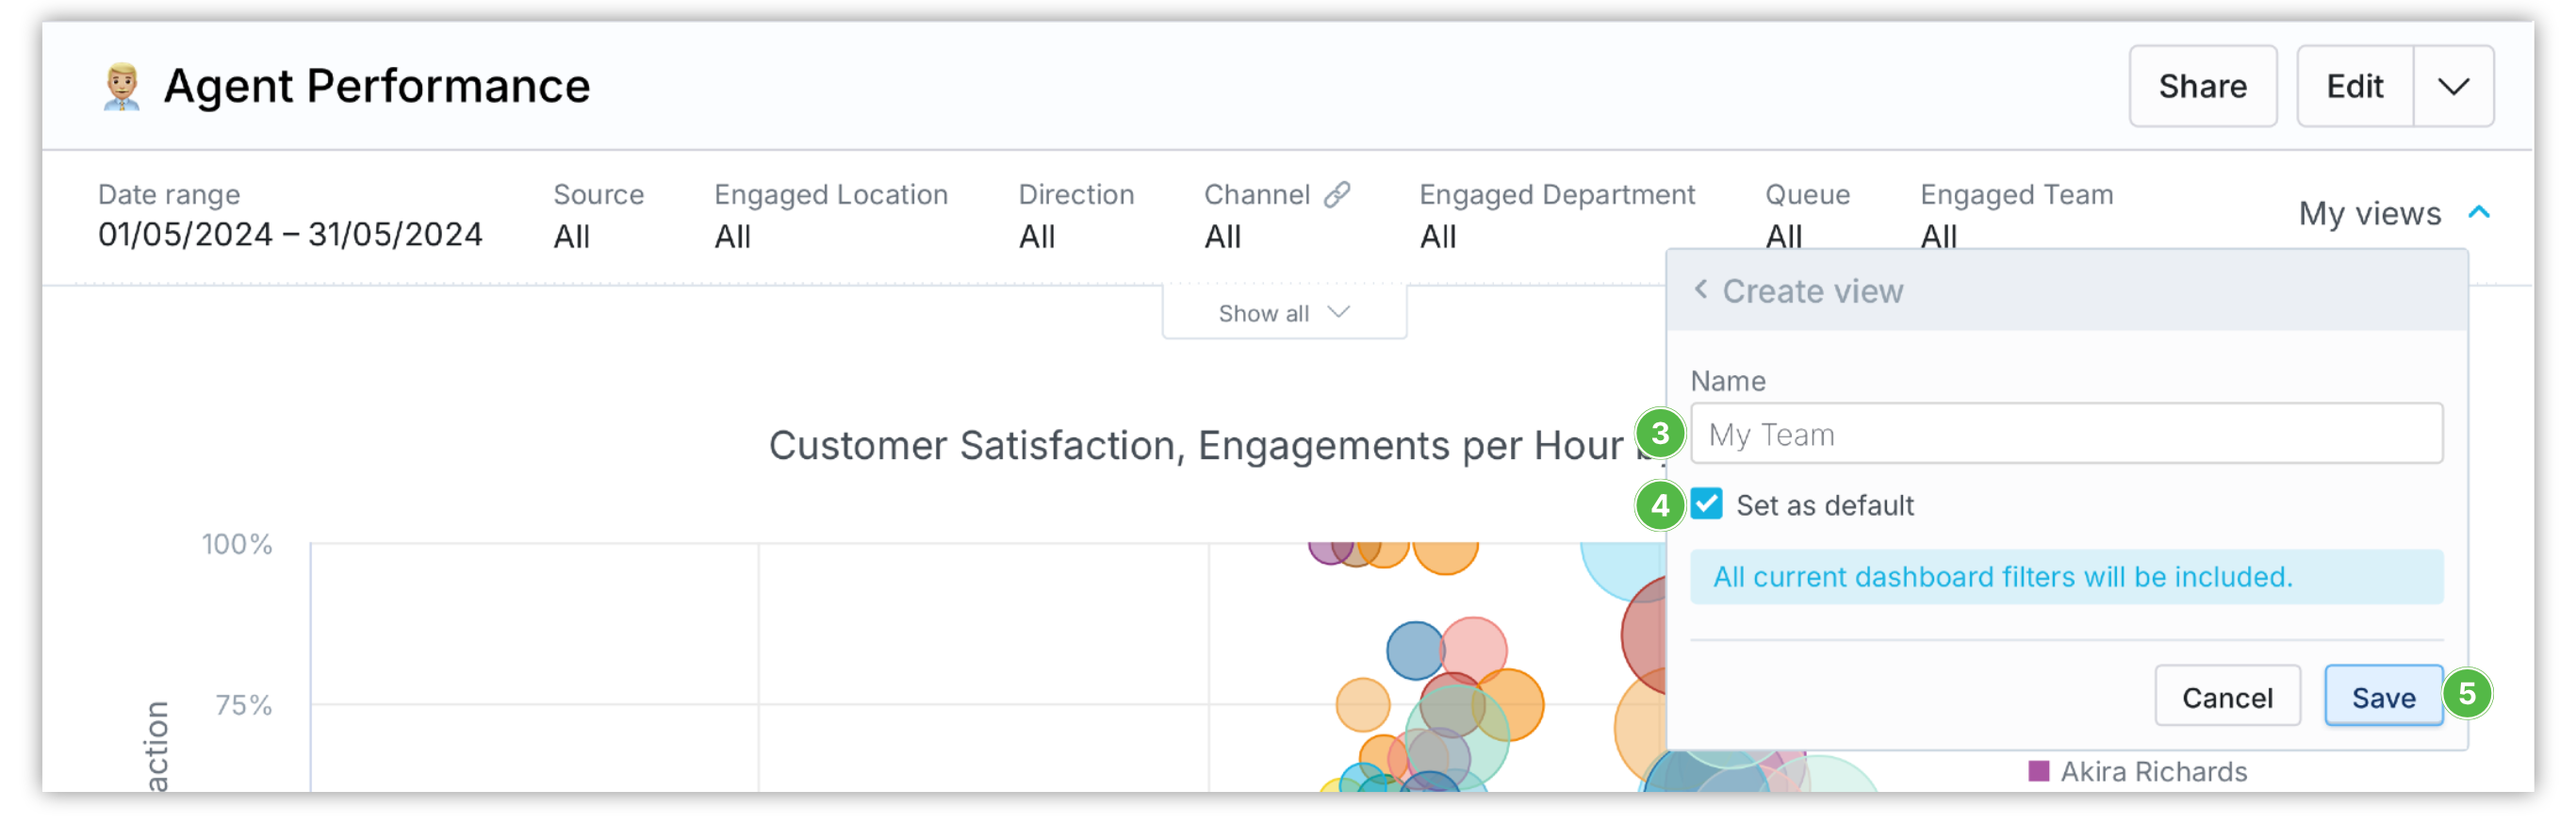
Name your saved view so it is easy to remember what data it shows
-
Check Save as default, if you want the newly created svaed view to be used by default when you open the dashboard
-
Click Save
From this point you can easily return to your filtering criteria with just two clicks.
Use Saved Views
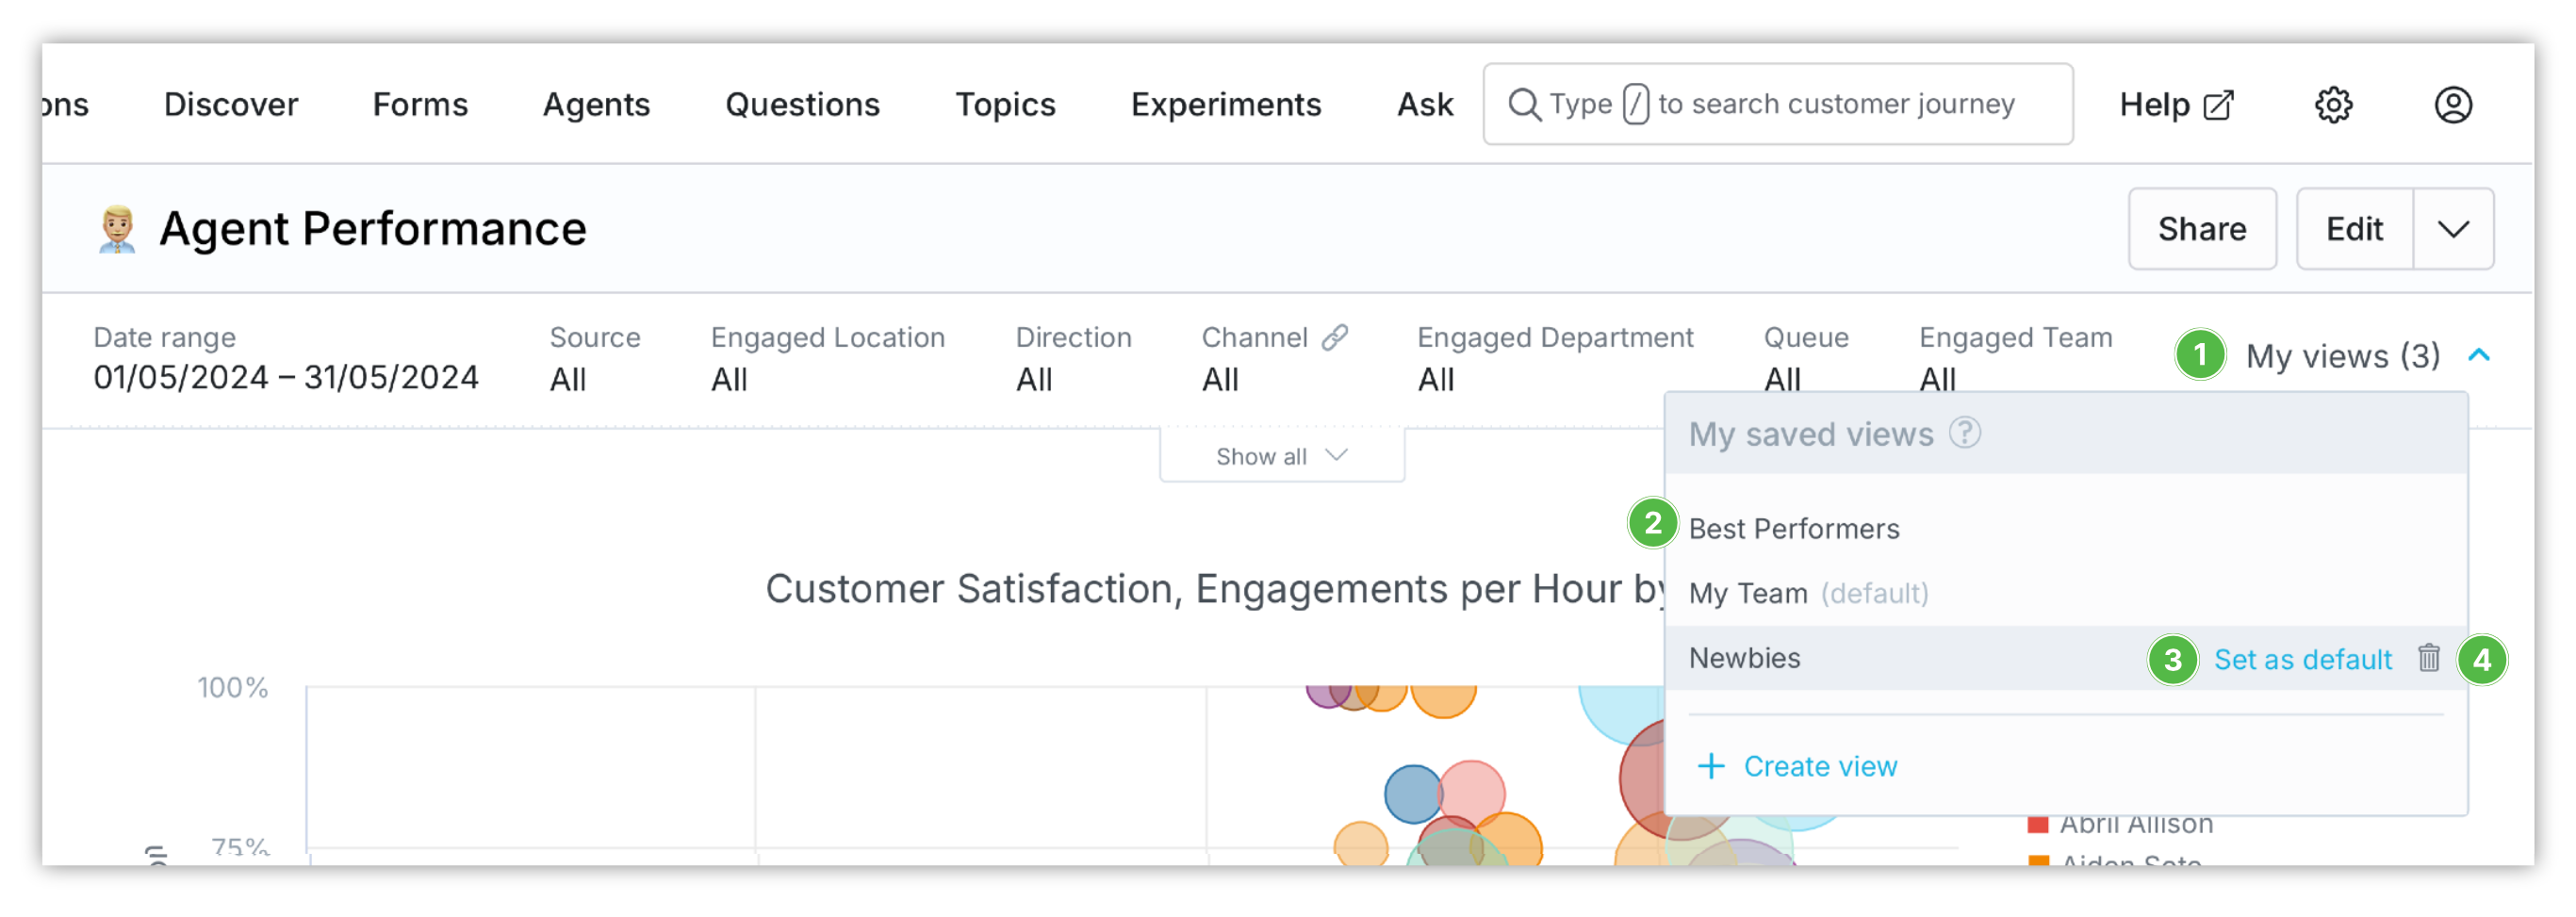
To load the saved filters:
-
Click My views
-
Click any of the saved views in the menu
To choose which saved view is used by default when you visit the dashboard, click ❸ Set as default option that appears when you move pointer over the menu item.
To delete any saved view, click ❹ trash icon that appears when you move pointer over the menu item.
Drill Downs
The dashboards are interactive. You can click attributes and metrics in charts and tables to explore them further. Items that you can click are bold. When you click these items they can either take you to a specific dashboard or to Customer Journey.
You can also add drill-downs to your custom dashboards. Learn more about Drill Down from Dashboards.