Performance Tips
Salted CX is designed to provide a good performance on top of large volume of conversations including their content. We target to have render times most of the time within a few seconds. However there are still technological limits and complex visualizations may take longer to render. This article covers best practices to minimize those instances.
The performance of the rendering depends on many factors, including but not limited to:
- Metric complexity. We give users extreme flexibility to create metrics that match their business needs. This may opens possibility to crate metrics that use excensive resources even when run on top high-performance storage.
- Size of the data used for metric calculation. Larger volume of data for calculation means more data needs to be processed. There are technological limits to how fast data can be moved in ant system. This is mostly influenced by filters, eventually by metrics in case they ignore filters by definition.
- Total size of data in your Salted CX account. Depending on metrics definition and filtering criteria it might be impossible to take advantage of certain performance optimization and processing all data might be needed.
Metric Complexity
Metric complexity is a key factor driving performance.
- Prefer metrics that do not require traversing multiple data sets. For example metric that uses Review data set and Customer data set needs to traverse 3 large dat sets.
- Restrict metric to filter for relevant items. It is good practice to filter by (Engagement, Review) Type and Status not just for performance reasons but to focus metric on data that are really actionable and avoid mixing unrelated data.
Filters
Filters reduce the volume of data that we need to process. When creating a new visualization or a new dashboard we use 30 days filter by default.
- Avoid working without date filters. This generally leads to processing all data. Which means the more conversations you have collected so far the slower the computation runs.
- Prefer 30 days or shorter time filters in visualizations and dashboards. The most valuable information is typically in the most recent conversations anyway.
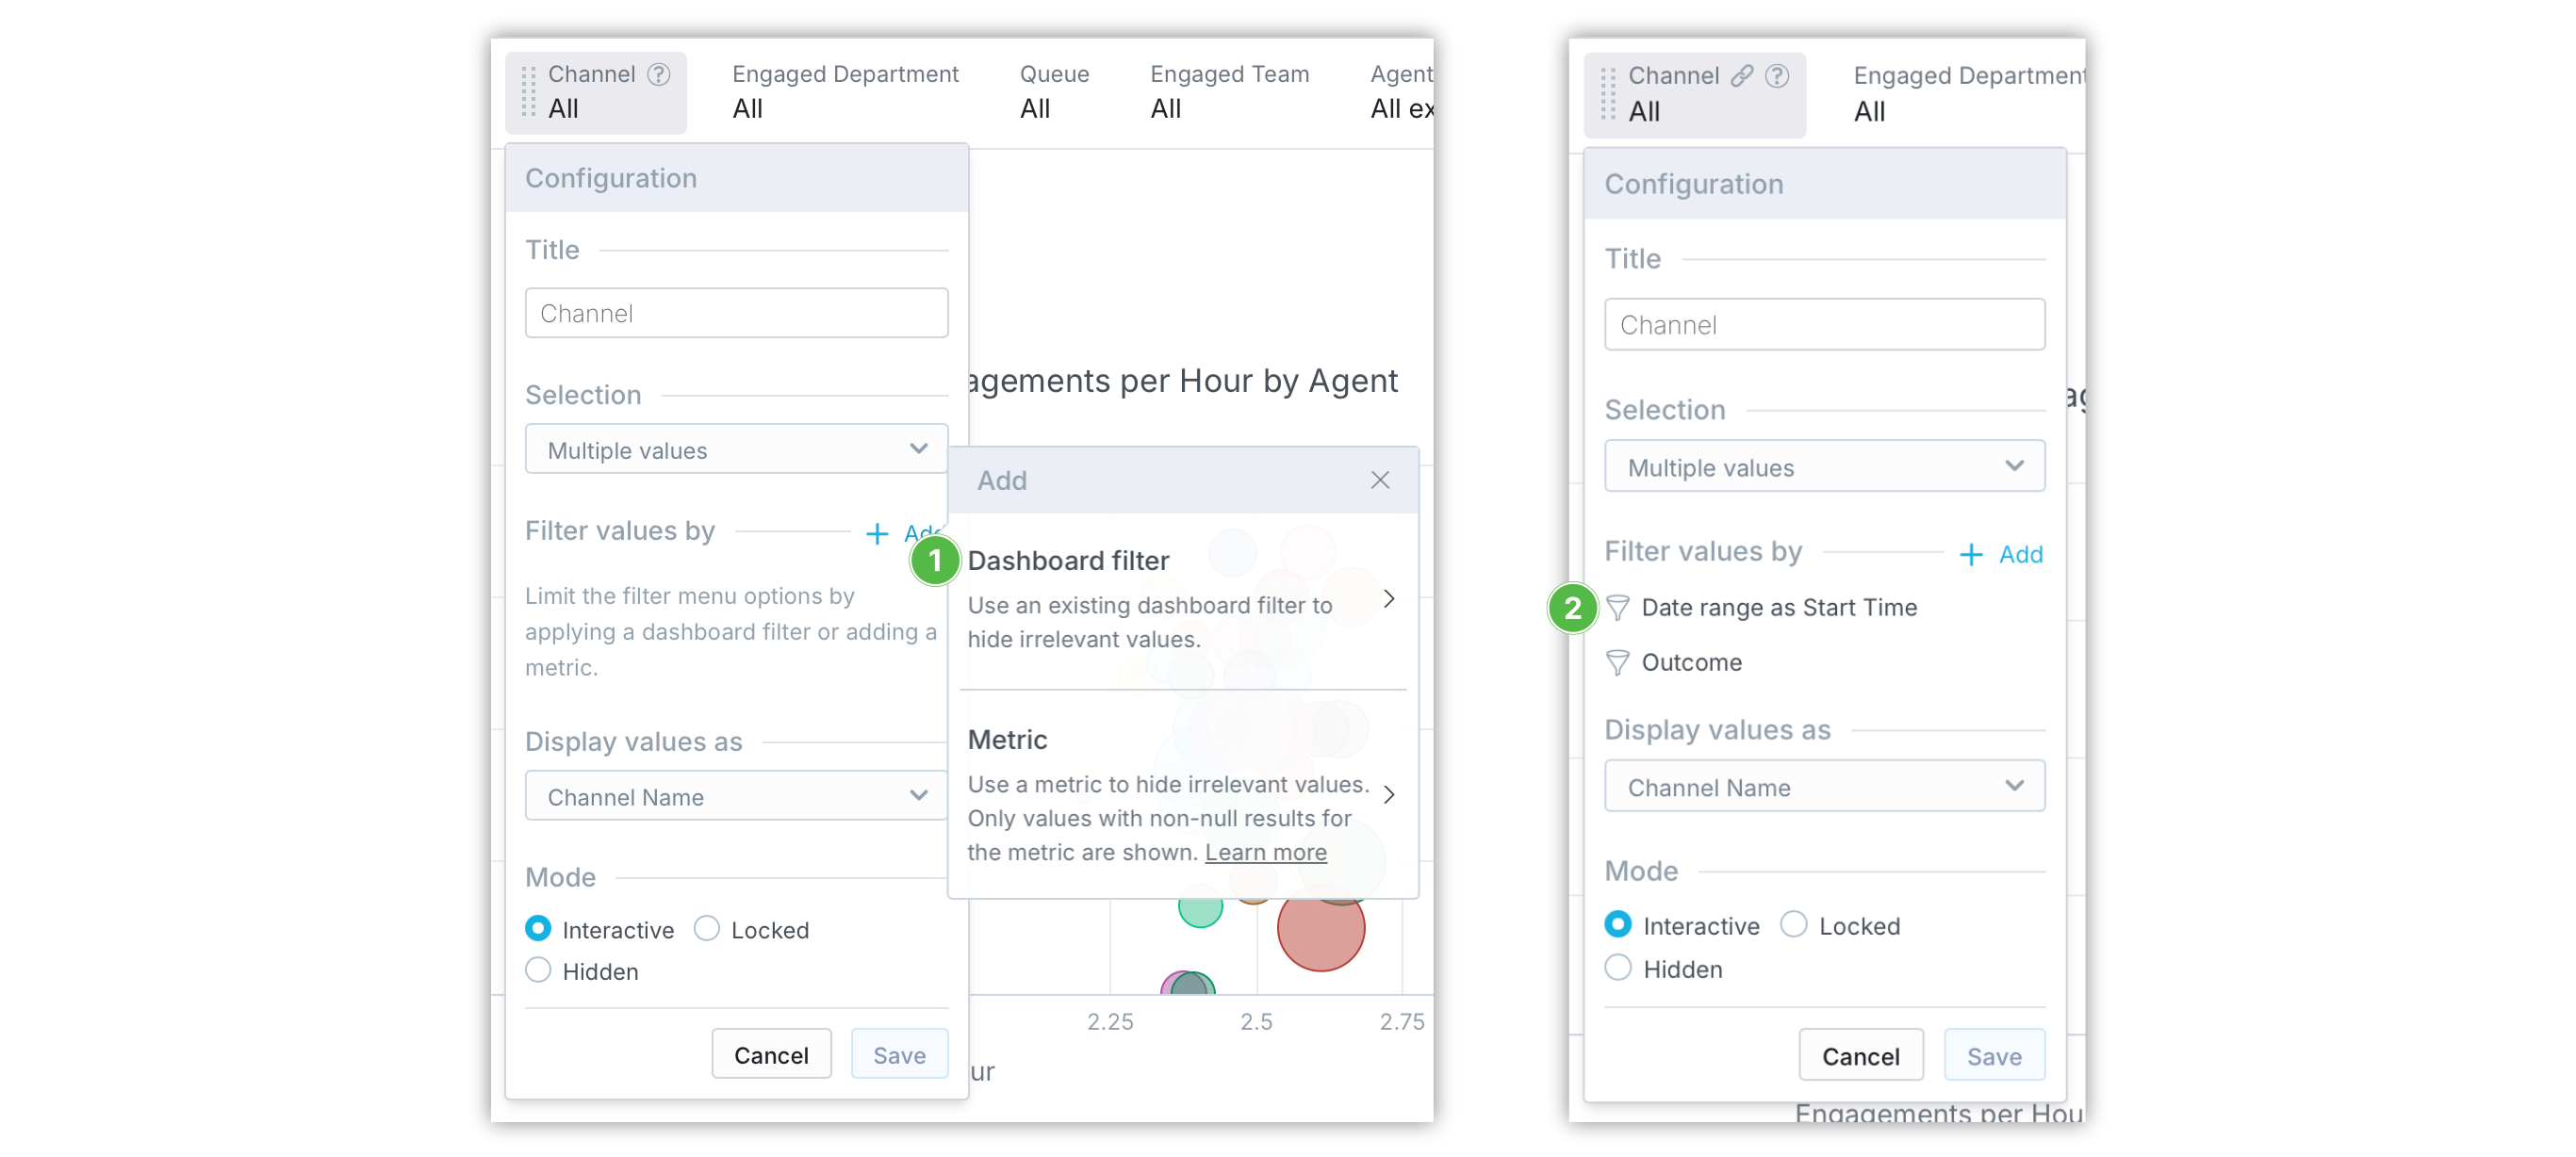
- Using hierarchical filtering criteria where values available in one filter depends on another filter ❶. This often requires exploring all data in your account. If you need to use these dependency filters consider adding filter based on date that narrows the search for available attribute values ❷.
Dashboards
Dashboards contain a collection of visualizations. All visualizations in a dashboard start rendering in the same time and run in parallel. If the dashboard contains a lot of visualizations.
- Prefer dashboards that fit on a screen. When you have a long scrollable pane with many visualizations the visualizations that are not visible to users delay for visualizations that are visible to user. It is good practice to have all data that users need to fit the screen and use drill downs and filtering to provide additional perspective.